My Pdb++ config and extensions
In the present era of software development no one needs to be convinced about the benefits of
interactive tooling for programming languages. Since eternity, Python shipped with a built-in
GDB-style command-line debugger, Pdb, as well as a base debugger interface, bdb. Pdb though, is
rather barebones, lacking tab completion and many other usability features. It also can shadow
Python identifiers, which is extremely annoying, for example list(x) will not invoke the
list constructor but the list Pdb command, and one needs to do p list(x) to avoid that.
The Jupyter project came up with its ipdb, which ships with IPython. My debugger of choice,
however, is Pdb++, which I started using because, unlike ipdb, it didn’t fail when used in
Pytest tests with stdout capture turned on.
Unlike ipdb, Pdb++ hijacks the built-in pdb.Pdb class, which has its positive and negative
sides. Positives being it “just working” with any tooling which invokes the stock pdb, while
the negatives being potentially introducing crashes in these tools, due some of Pdb++ overrides
violating the Liskov substitution principle.
This article will focus on the way I use Pdb++, not whether or not one should use it.

Configured Pdb++
My Pdb++ config - annotated
Pdb++ can be configured by the ~/.pdbrc.py file. Since it’s a normal Python file, found and
imported by Pdb++, it gives you a lot of power of customisation.
The snippets available below depend on the following imports:
import inspect
from pdb import DefaultConfig, Pdb
from pprint import pprint
The config object
class Config(DefaultConfig):

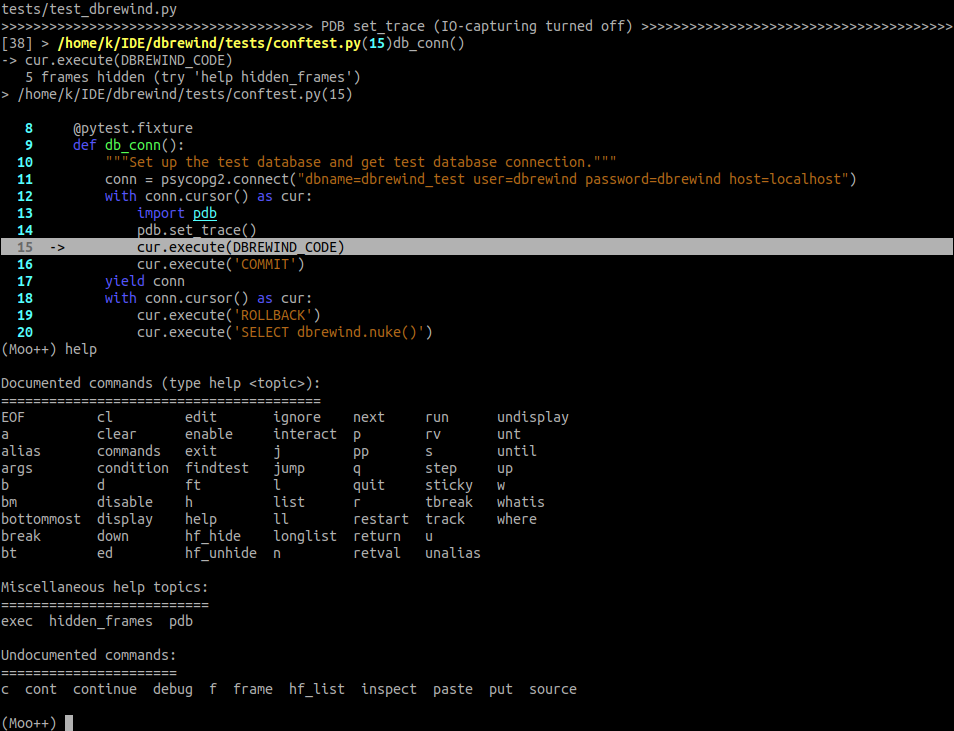
    prompt = '(Moo++) '
    sticky_by_default = True
    # The 256 colour formatter prints very dark function names:
    use_terminal256formatter = False
The config class is rather
self-explanatory. sticky_by_default is a huge usability feature - think of it as automatic code
listing. Extremely helpful when navigating the stack up and down, and advancing through code. The
changed prompt is non-essential, although it helps identify that other Pdb customisations are in
place.
The displayhook
def displayhook(self, obj):
    """If the type defines its own pprint method, use it on its instances."""
    pprint_impl = getattr(obj, 'pprint', None)
    if (
        pprint_impl is not None and
        inspect.ismethod(pprint_impl) and
        pprint_impl.__self__ is not None  # Only call if bound to an object.
    ):
        pprint_impl()
    else:
        pprint(obj)

Pdb.displayhook = displayhook
This snippet enables pretty-printing of all values by default. Regular printing can still be
achieved by the p, or print command.
Pdb.displayhook = displayhook monkey-patches the displayhook on the Pdb class already replaced
by Pdb++.
Quality of life commands
def do_findtest(self, arg):
    """Find the closest function starting with 'test_', upwards the stack."""
    frames_up = list(reversed(list(enumerate(self.stack[0:self.curindex]))))
    for i, (frame, _) in frames_up:
        if frame.f_code.co_name.startswith('test_'):
            self.curindex = i
            self.curframe = frame
            self.curframe_locals = self.curframe.f_locals
            self.print_current_stack_entry()
            self.lineno = None
            return


def do_bottommost(self, arg):
    """Go to the bottommost frame."""
    last_frame = self.stack[-1][0]
    last_index = len(self.stack) - 1

    self.curindex = last_index
    self.curframe = last_frame
    self.curframe_locals = self.curframe.f_locals
    self.print_current_stack_entry()
    self.lineno = None
    return

Pdb.do_findtest = do_findtest
Pdb.do_ft = do_findtest
Pdb.do_bottommost = do_bottommost
Pdb.do_bm = do_bottommost
These commands, registering as findtest or ft and bottommost or bm automate
navigating through the stack, most helpful in post-mortem test debugging. findtest walks the
stack upwards, until it sees a function that looks like a test (starting with test_, which is a
Pytest convention), while the bottommost command can be used return to the error site after
using findtest, or simply go down the stack, to the debugger invocation site or exception
origin, no matter what you were doing before.
An anecdote
Long before I published my config here, I shared it with my now former team lead. They took the config and the use of Pdb++ to their next job. Someone noticed it during a presentation and wanted to know more, which resulted in the following exchange:
– Hey, I wanted to ask you about the nice looking Pdb CUI tool you used in the demo.
– Aa. Pdb++? Yeah, I’ve been wanting to add that everywhere for a while.
– Ah ok, I thought I saw ‘Moo++’ or something.